As mentioned in an earlier blog post this year, hardware debuggers are the premier class of embedded debugging tools. However, until today, there were only very few relatively expensive tools around supporting the debugWIRE interface that is used by the classic ATtinys and a few ATmega MCUs.
The good news is that now you can turn an Arduino UNO, Nano, or Pro Mini into a debugWIRE hardware debugger that communicates with avr-gdb, the AVR version of the GNU project debugger.
What is dw-link?
Based on RikusW’s reverse engineering of the debugWIRE protocol and on other people’s work implementing debugWIRE debuggers and GDB stubs for the AVR, such as
- the host-based debugger dwire-debug,
- the Pascal implementation of such a host-based debugger debugwire-gdb-bridge, and
- the Arduino-based DebugWireDebuggerProgrammer, and
- the GDB stub avr_debug,
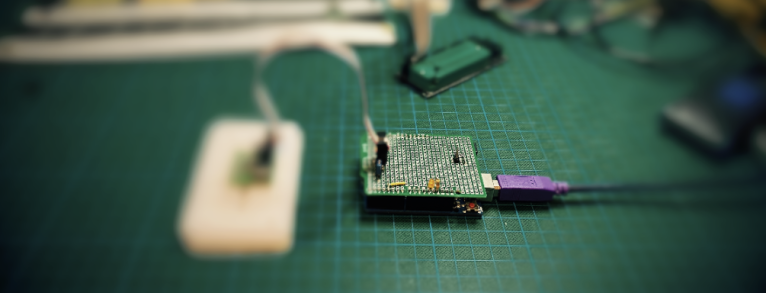
I have developed dw-link, an Arduino sketch that turns your Arduino Uno or similar board into a hardware debugger. Basically, the hardware debugger translates between the debugWIRE protocol communicating with the target on one side and the GDB remote serial protocol (RSP) communicating with the host debugger on the other side, as shown in the following picture.

It is actually a bit more than a simple translation because RSP commands cannot be translated one-to-one into debugWIRE commands. For instance, writing into flash memory happens by arbitrary chunks in RSP, while in debugWIRE flash memory has to be written page-wise. Further, breakpoints are set and removed in a lazy fashion in order to minimize flash memory wear. And then, the different MCU types have all somewhat different ways to implement the debugWIRE operations.
How can you use it?
Using the hardware debugger is straightforward. First, you need to set up a debugging environment/IDE and/or modify some configuration files of your Arduino environment, as described in my earlier blog post. Then you simply need to
- download the Arduino sketch from the dw-link GitHub repository,
- upload it to a UNO or equivalent board,
- connect the UNO board to the host (over USB), and
- connect the UNO board to a target using a modified ISP cable or 6 single wires.
The details are described in the manual, which you also can download as a PDF file. I also posted a YouTube video explaining how to set up a debugging environment and wrote a background article on CodeProject.
What are dw-link’s strong points?
- It works with all hosts that support avr-gdb.
- It runs on all ATmega328 boards.
- It uses a robust and accurate single-wire serial communication library for communication over the debugWIRE line.
- It supports high communication speed on the debugWIRE line even if the target MCU clock frequency is only 1 MHz.
- It provides up to 32 software breakpoints.
- It supports single-stepping that does not jump into interrupt routines.
- Switching between debugWIRE and normal mode is straightforward.
- It has been tested on all MCU types that are supported by ATTinyCore, by MiniCore (except for ATmega48PB, ATmega88PB, ATmega168PB), and by MicroCore.

February 2, 2022 — 22:24
Maybe it is now time forimplementing UPDI?
😉
February 3, 2022 — 13:15
You are not the first to point this out ;-). Well, I guess I need some time to recover before I’ll have a look at that. In any case, there appears to be more information available about UPDI than about debugWIRE. So it should be easier. And perhaps, one can take dw-link as a blueprint.