The featured image of this blog post is by Chen from Pixabay
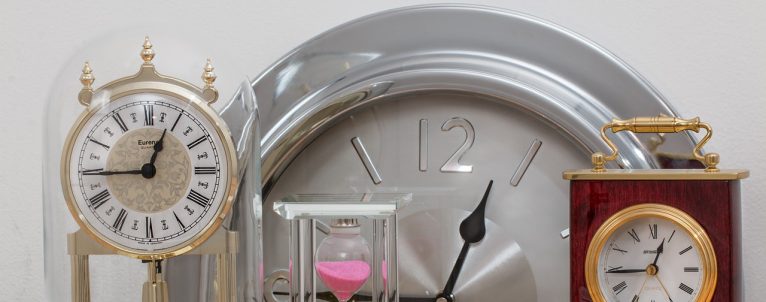
What is a real-time clock? Why do you need one? What are the use cases? How accurate can a real-time clock be? Which features can a real-time clock have? Which models are around? And which one should you buy?
Continue reading


