
The featured image of this post is based on a picture by Florian-if published on Wikipedia under CC-BY-SA-3.0
Is it possible to build a hardware debugger for debugWIRE for less than €10? As it turns out, it is. You just have to make a few compromises and also do a bit of soldering and gluing.
Hardware debuggers for cheapskates
After I had finished the implementation of dw-link, an Arduino sketch that can turn your UNO into a debugWIRE hardware debugger, somebody asked me whether it would be possible to run the sketch on a USBASP ISP programmer, something you can get for a few € on eBay, AliExpress, or Amazon. Indeed, that would be very attractive. You could buy the system dirt cheap, it already has everything on board including an ISP cable, and one would only need to reflash the firmware. Unfortunately, it does not work since these programmers have only an ATmega8 on board, but dw-link needs an ATmega328. And then there are other reasons why it wouldn’t work, such as that the SingleWireSerial library does not go together with the interrupts required by the USB subsystem.
The question, however, started me thinking about how far we are away from this situation. Doing a little search, it turns out the USBASP programmers are only dirt cheap when you buy them directly in the Far East, which means it takes a couple of weeks before they arrive. Then you can get them for 3-€4 including postage. In Germany, you have to pay at least €7 (incl. postage). So, what is the situation with Unos and Nanos? Turns out that you get a Nano in the Far East for €3, in Germany you get them for around €7, and a Uno for €8.50 (including postage). So, the price of the basic system is almost the same. The question is, how much do you have to add to it, and how convenient the resulting system is.
Opening a can of wires
My initial example in the dw-link manual shows how to connect a UNO turned hardware debugger to a target chip using 6 wires. These are the usual ISP wires, of which the SPI lines are only used to set/reset the DWEN fuse and maybe some other fuses as well. Nevertheless, you want to have all of them.
Putting myself into the shoes of an Arduino hobbyist (well, I am one), I would use a debugging tool only if applying it is relatively painless. If I need to make six connections, need to double-check that the connections are right, and then, in the end, get the message “Cannot connect: Check wiring,” the initial enthusiasm for using a debugging tool would quickly vanish.
There is an obvious solution to this problem, namely, using an ISP programming cable as you would use it when you turn your Uno into an ISP programmer. It can be plugged into the ISP connectors on the debugger/programmer board and on the target board. Only the RESET line is broken out on the debugger/programmer side.
Djmlambert describes in an instructable in a very detailed way how to build such a cable. He adds even a cap between RESET and GND on the programmer side, in order to disable the auto-reset feature of the Uno. This is helpful, but optional for the hardware debugger.
I myself built such a cable, where I also broke out the Vcc wire so that for targets that are not so power-hungry, I can use the automatic power-cycle feature of the debugger.
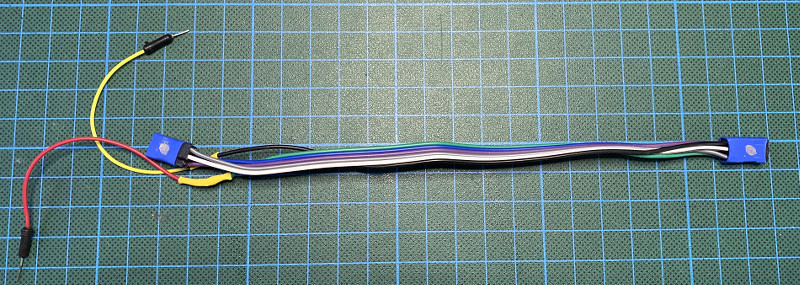
In addition to the cable, you can insert a cap of 10 µF between RESET and GND, and you probably want to add the system LED. In the first design, I used the built-in LED on pin 13 of the Uno as the system LED. However, that meant that one could not use an ISP cable as above, since the built-in LED is on the SCK line of the SPI bus, which we need for ISP programming. So now we need a separate system LED that can be plugged into the Arduino Uno connectors.
Both the cap and the LED are optional, but they both make life much easier. The cap prohibits a reset when the host connects to the debugger, which makes the startup two seconds faster. The LED shows the internal state of the debugger, e.g., when power cycling is required or when a restart because of an internal error is necessary.
The bottom line
Let us have a look at what is required.
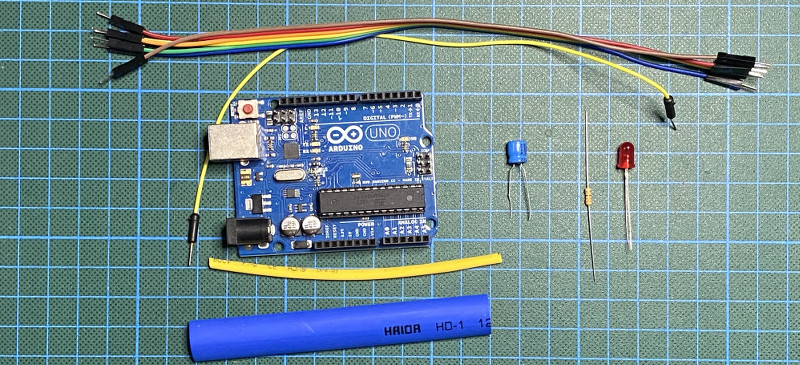
So, that is all that is needed. Let us add up the cost.
| Item | Price |
| Arduino Uno | 8.50 |
| 6 Dupont wires | 0.30 |
| 1 jumper wire | 0.05 |
| Heat shrink tube (2 pcs.) | 0.50 |
| Capacitor 10 µF | 0.07 |
| LED 5mm | 0.13 |
| Resistor 330 Ω | 0.03 |
| Sum | 9.58 |
This meets our budget limit of €10. But honestly, all of the above ingredients will be in the spare part box of an Arduino aficionado. So, the actual cost is closer to €0. And what does it look like when it is assembled?
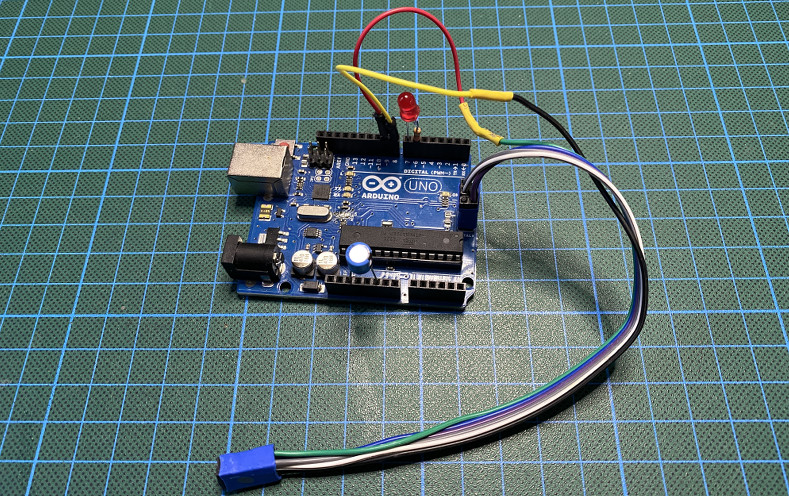
With this setup, you can apply the hardware debugger in 90% of the situations that come up. However, what about the remaining 10%? When you want to debug 3.3 V systems? When there should not be any load on the SCK line? When you want automatic power cycling for a power-hungry target?
Beyond the simple hardware debugger
One important requirement is an interface to 3.3-volt systems. There is actually an easy solution to it: Make your debugger a 3.3-volt system. There exist a few UNO compatible boards that allow switching between 3.3 and 5 volts: Seeeduino 4.2 and the Keyestudio PLUS Board. Both boards cost €11-€12 in Germany. When they are switched to 3.3 volts, they work beyond the specified maximum frequency. However, at room temperature, there should not be a problem.
Another option is to use level-shifting hardware such as the level-shifter breakout board with four BSS138 N-channel MOSFETs. As described in the manual, that works quite well, but you have pull-up resistors on the SPI lines of the target, which changes the electrical characteristics significantly.
My most preferred solution is, therefore, dw-probe, a printed circuit board, I have developed. It requires, however, the production of a PCB (which can be done at Chinese fabs for €0!) and SMD soldering, which is probably not for everybody.
Leave a Reply